🤖
R for SEO
  • Using R for SEO, What to expect?
  • Getting started
  • What is R? What is SEO?
  • About this Book
  • Crawl and extract data
    • What's crawling and why is it useful?
    • Download and check XML sitemaps using R'
    • Crawling with rvest
    • Website Crawling and SEO extraction with Rcrawler
    • Perform automatic browser tests with RSelenium
  • Grabbing data from APIs
    • Grab Google Suggest Search Queries using R'
    • Grab Google Analytics Data x
    • Grab keywords search volume from DataForSeo API using R'
    • Grab Google Rankings from VALUE SERP API using R'
    • Classify SEO Keywords using GPT-3 & R'
    • Grab Google Search Console Data x
    • Grab 'ahrefs' API data x
    • Grab Google Custom search API Data x
    • Send requests to the Google Indexing API using googleAuthR
    • other APIs x
  • Export and read Data
    • Send and read SEO data to Excel/CSV
    • Send your data by email using gmail API
    • Send and read SEO data to Google Sheet x
  • data wrangling & analysis
    • Join Crawl data with Google Analytics Data
    • Count words, n-grams, shingles x
    • Hunt down keyword cannibalization
    • Duplicate content analysis x
    • Compute ‘Internal Page Rank’
    • SEO traffic Forecast x
    • URLs categorization
    • Track SEO active pages percentage over time x
  • Data Viz
    • Why Data visualisation is important? x
    • Use Esquisse to create plots quickly
  • Explore data with rPivotTable
  • Resources
    • Launch an R script using github actions
    • Types / Class & packages x
    • SEO & R People x
    • Execute R code online
    • useful SEO XPath's & CSS selectors X
Powered by GitBook
On this page

Was this helpful?

Explore data with rPivotTable

PreviousUse Esquisse to create plots quicklyNextLaunch an R script using github actions

Last updated 2 years ago

Was this helpful?

is a great package by Enzo Martoglio that allows you to explore a small dataset using an HTML drag&drop interface that looks like the pivot interface from Google Sheet or Excel.

Install and load rPivotTable

as usual the instruction are quite straightforward

#install package rpivottable to be done once
install.packages("rpivottable")
# And loading 
Library(rpivottable)

Imagine you want to explore a data frame called MERGED ( see )

Its just one line of code

# launch 
rpivotTable(MERGED)

it will open an HTML page, and you'll be able to drag and drop KPIs from the left column
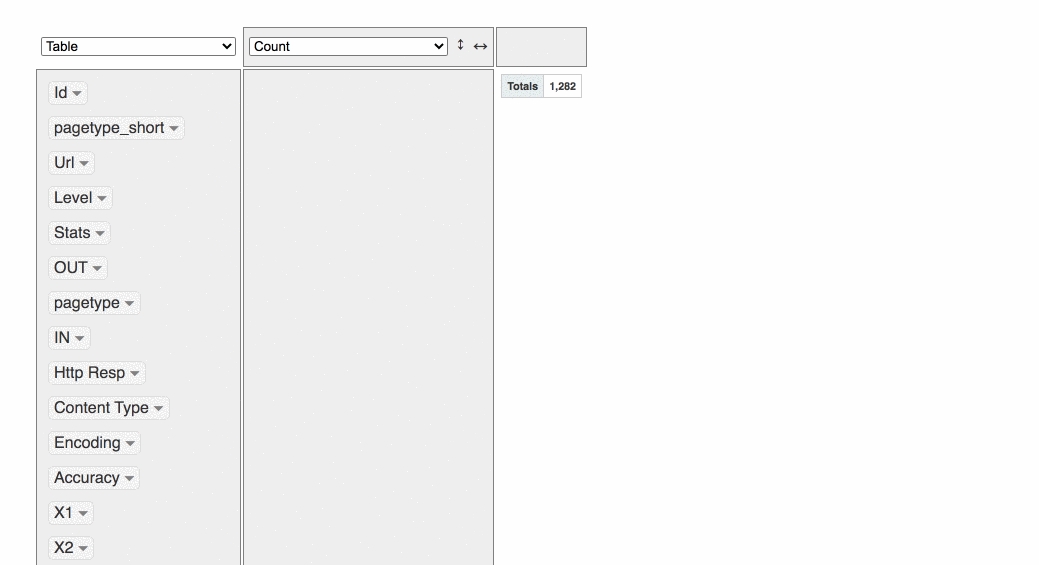
This create a drag & drop pivot explorer

You can also use the top dropdown list to make it display a plot instead of a table.
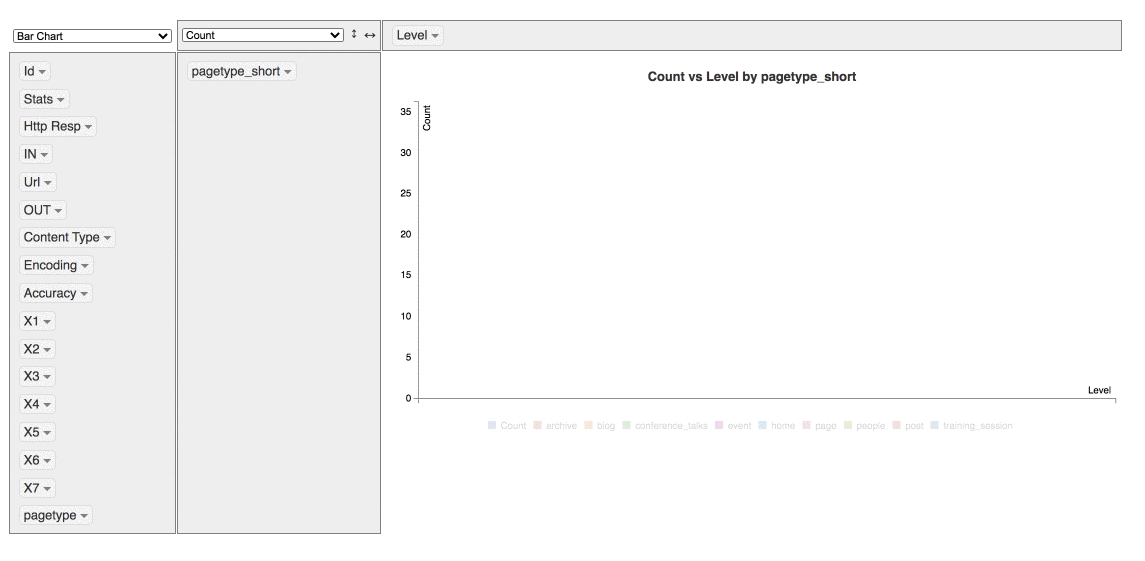
To easily sort

and filter

It’s also possible make some quick data viz

to try it yourself.

Here is a demo HTNL file
rpivotTable
how to create a data frame using a CSV file